We use cookies to improve your experience on our website and for marketing. Private Policy.

Date Hierarchies in Power BI Integration Extension
June 25, 2024
Date Hierarchies in Power BI Integration Extension
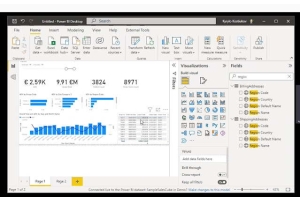
The Power BI Integration Extension by InsightsReady includes a powerful feature: Date Hierarchies. This functionality is designed to streamline and enhance the reporting capabilities within Power BI, allowing users to create more intuitive and insightful visualizations by leveraging the power of hierarchical data organization.
Understanding Date Hierarchies
Date hierarchies are essential for breaking down dates into multiple levels, such as year, quarter, month, and day. This hierarchical structure allows users to drill down into data, uncovering trends and patterns that might not be immediately apparent in a flat dataset. By organizing data in this way, users can perform more detailed analyses and create more dynamic reports.
Creation of Date/Time Hierarchy Table Profiles
To leverage the Date Hierarchies feature, follow these steps:
Step 1: Navigate to the Table Profiles Page
- Go to the Reports Section: Access the "Reports" section under "Insights Ready" in your Power BI Integration Extension.
- Add a New Table Profile: Click on "Add New Table Profile" to start creating a new profile.

Step 2: Select the Date/Time Hierarchy Type
- Choose Profile Type: From the dropdown menu, select the "Date Time Hierarchy" type.
Step 3: Fill in the Profile Details
- Profile Name: Set a suitable name for your profile.
- Type: Choose between Date or Datetime, defining the data type to be used in the dataset.
- First Year: Set the starting year for data gathering.
- Last Year: Set the ending year for data gathering.
- Time Granularity: Define the level of detail based on intervals of seconds, minutes, or hours.

Step 4: Save the Profile
After filling in all the mandatory fields correctly, click the "Save Profile" button at the top of the page to finalize the creation of your Date/Time Hierarchy Table Profile.
Adding the Profile Table to a Power BI Dataset
To display a profile table in Power BI, follow these steps:
Step 1: Create a New Dataset
- Navigate to the Datasets Section: Go to the "Datasets" section in your Power BI workspace.
- Click on "Create Dataset": This will open the dataset creation interface.
Step 2: Add a Table with the Created Table Profile
- Select the Table Profile: From the dropdown menu in the "Table Profiles" section, select the profile you created earlier.
- Add the Table: Click "Add Table Profile" to include the table in your dataset.

Step 3: Save the Dataset
After adding the table, click the "Save Dataset" button to save your new dataset. This will enable you to use the table with the Date/Time Hierarchy in your Power BI reports.
Using Date Hierarchies in Reports
Once you have created your Date/Time Hierarchy Table Profile, you can use it to enhance your Power BI reports:
- Open Your Power BI Report: Navigate to the Power BI report where you want to use the date hierarchies.
- Add Date Fields to Your Report: Drag and drop the date fields from your newly created profile into your report visuals.
- Utilize Hierarchy Levels: Use the drill-down functionality to explore data at different hierarchy levels. You can move from a broad view (e.g., year) to a more detailed view (e.g., month or day) by interacting with the visualizations.
- Apply Filters: Use the filter pane in Power BI to apply filters at any level of the hierarchy. This allows you to focus on specific time periods and analyze data in greater detail.
- Adjust Filters Dynamically: As you drill down into the data, adjust the filters to refine your analysis further.
Benefits of Using Date Hierarchies
Enhanced Data Analysis
Date hierarchies allow for more sophisticated data analysis by enabling users to explore data across different time periods. This can reveal seasonal trends, year-over-year growth, and other time-based insights that are crucial for strategic planning and performance evaluation.
Streamlined Reporting
By organizing data into hierarchies, reports become more intuitive and easier to navigate. Users can quickly move between different levels of detail, making reports more user-friendly and reducing the time needed to find specific information.
Increased Flexibility
The ability to create custom table profiles and automatically detect date fields provides users with increased flexibility in how they structure their reports. This ensures that the most relevant data is always front and center, tailored to the specific needs of each report.
The Date Hierarchies functionality in the Power BI Integration Extension by InsightsReady enhances the ability to analyze time-based data effectively. By breaking down dates into hierarchical levels, users can create more insightful and dynamic reports, ultimately driving better decision-making and business outcomes. Whether analyzing sales trends, inventory levels, or any other time-based data, the Date Hierarchies feature is an invaluable tool in your Power BI toolkit.
0 Comment(s)
Recent Posts


Featured Posts