We use cookies to improve your experience on our website and for marketing. Private Policy.
How to Create a Report using Magento Dataset in Power BI Service?
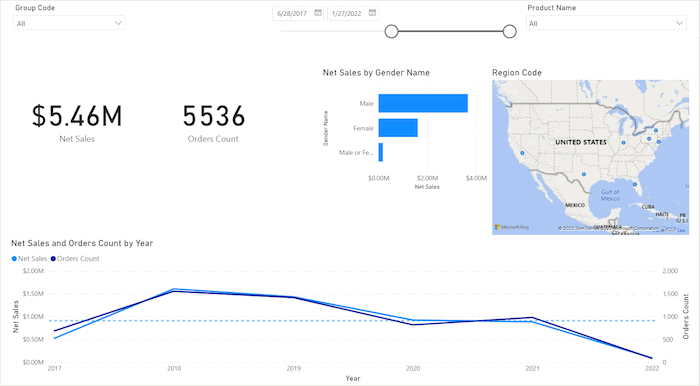
Magento Dataset in Power BI Service
Here, in this article, we will explain how to easily create a Power BI report using the Magento dataset of your online store real time data. Thanks to our solution, Power BI Sales Cube Magento extension , your data from Magento 1 or 2 store can be easily transferred to Power BI where you can make an analysis which then will show you how to improve your business working on its weak sides.
After reading this guide, you will be able to develop nice, colorful business intelligence reports with comprehensive data visuals and graphics. We will show how to create the report, how to prepare the data for evaluation, which filters to apply, how best visualization can be achieved and more.
However, if it is the first time you are working with Power BI service, we must warn you about the fact that it has certain restrictions compared to the Desktop version:
- You cannot add formulas or metrics in Power BI service.
- A report created in Power BI service cannot be downloaded and then edited in Power BI Desktop.
- The final report version cannot be shared.
This means that, if you want to share your final results with teammates, or, maybe your Magento online store dataset needs any further improvements or else of your choice, you may not be able to do all these necessary steps using PBI service only.
It is generally advised to start creating business analysis reports in Power BI Desktop packed with add-on and having it installed on your laptop or PC.
Nevertheless, this process will require more broad knowledge and some analytical and accounting skills for dwelling deeper in the world of BI services and modules.
Power BI Sales Cube Magento Extension
No matter what your final aim is, if your desire is to make your business stand out and generate more profit for your happiness, you cannot go without Power BI for Magento reporting extension .
Checklist:
Step 1: Opening Power BI Workspaces
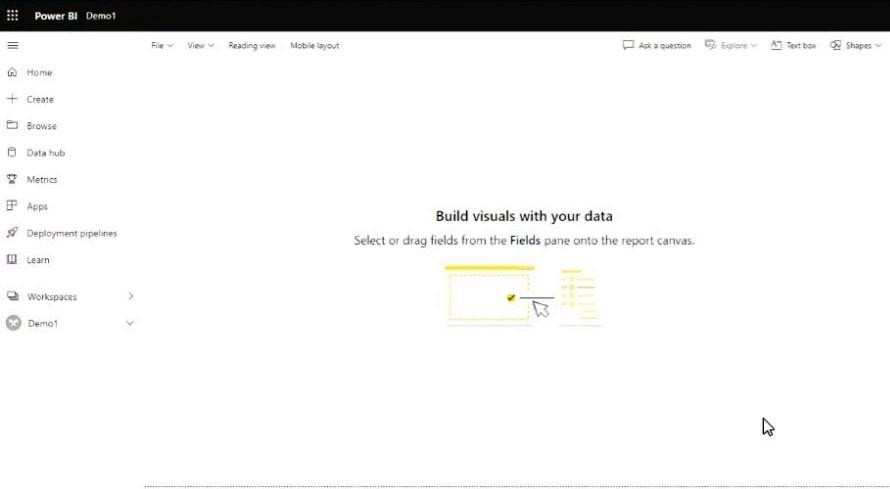
Open Power BI service and select "Magento dataset" as a source data for your report. Than, Click the "Create report" button. You will see the empty report sheet to be filled up with the data.
Step 2: Pre-filter Your Data
This step will refine your data set for further analysis. This step of pre-filtering the dataset will help you minimize the data you will work on further. By doing this, your chances to get a more precise analysis in return are much higher.
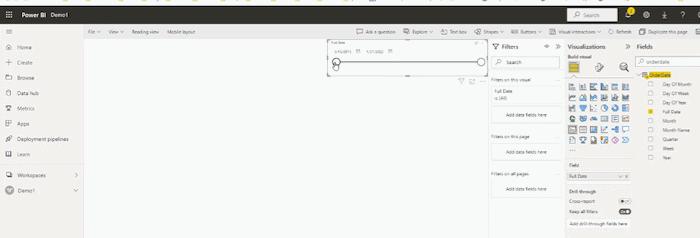
The first pre-filter option we will use is by the OrderDate. Firstly, you need to type in the phrase “OrderDate”. Secondly, drag a FullDate set to your blank report field. You will see the list of dates the customers have ordered from you:

Now, let’s transform FullDate into a Slicer. The Slicer enables you to manually edit the time period you want to review and analyze. Click and drag a dot button to change the time frame. The Timeline slicer is a graphical date range selector used as a filtering component in Power BI.
Use the slicer by moving the dot as the image below shows:
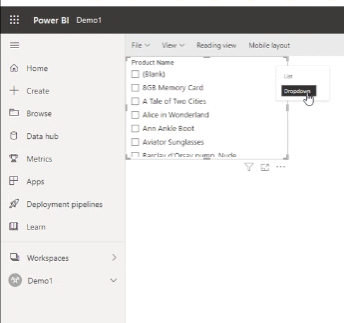
Now let’s add the ProductName category. Type in “ProductName” and drag it into your report. Apply a Slicer as you did above.

Lastly, transform ProductName using a Dropdown list feature. This action will save more place of your report enabling you to add more parameters:
Step 3: Adding Measures
Measures are used when we want to find out the amount of something, the extent or the size. A KPI (key performance indicator) is a quantifiable measure of performance over time for a set objective.
In BI eCommerce, KPIs are measures used to evaluate the success of an organization. The good examples of KPIs are: sales revenue growth, profit margin, client retention ratio, customer satisfaction, etc.
We will add to our report NetSales and the OrdersCount as the KPIs. And below we will also add the timeline between the set KPIs. We will place OrdersCount and NetSales on different axis on the timeline in order to have them displayed nicely on the chart
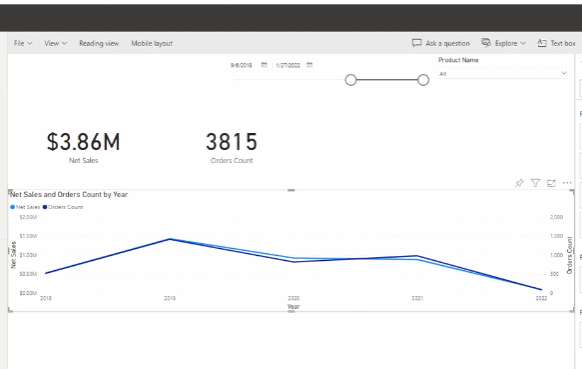
On a timeline we will use OrderDate. Another option will the usage of InvoiceDate. The thing that varys in these two parameters is the timing. In other words, the OrderDate is the date when the customer only places the order. The InvoiceDate, in its turn, is when the order is fulfilled by the customer.
In addition, the Invoice is the alert for your client to pay for the order placed before. It means that the transaction is processed and the time to pay money has come.
For better understanding the differences between the two, in business the two core parameters were distinguished:
Purpose. Here, the OrderDate will serve as an inner company's document for tracking the overall orders' turnover. Unlike the Invoice date will serve for the order to be delivered to your client. In essence, the Invoice is the receipt of the rendered service or services.
Timing. The second difference is the time frame between the OrderDate and InvoiceDate. The OrderDate only shows the customer's willingness to buy something, and it serves as a starting point to initiate the transaction. On the other hand, the Invoices are mostly created to end the transaction(s). Meaning that the order is fulfilled and reached its client.
In analytics, we usually use Order Date for reporting on Grand Total values and Invoice Date for calculating Profit or Net Sales values. Here, it is important to understand that Grand Total will remain the same with time, but Net Sales will keep changing, since some orders may get refunded after the report has been created. In case of reporting by using Invoice Date, the data will also change if orders created within the reporting period will get invoices assigned.
Step 4: Segmenting the Analysis
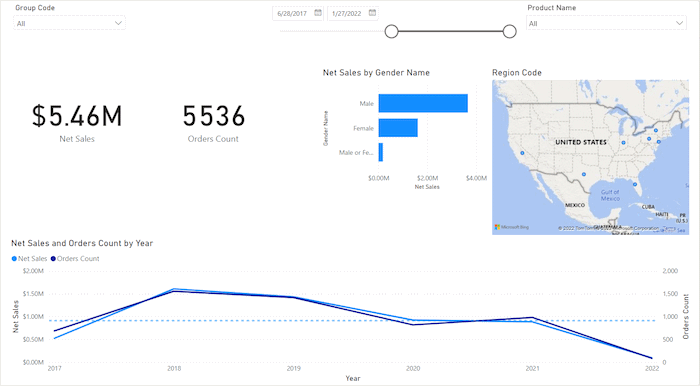
For example, we want to know more about the target audience of our online store. For this purpose, let’s segment your data by Region Code. to see the location from where our clients are.
After that, let’s segment the data we are working with by the following parameter Net Sales / by Gender Name. The report shows that males are prone to economize when it comes to purchases more than females. Because the NetSales are going down here.

How to add more value to your Magento dataset in Power BI service report ?
You may apply Customers--->Group Code to add value to your analysis. After choosing Customers--->Group Code, make a Dropdown list like it is shown here:
Or the value can be added by applying AVG Yearly Net Sales as an additional parameter.
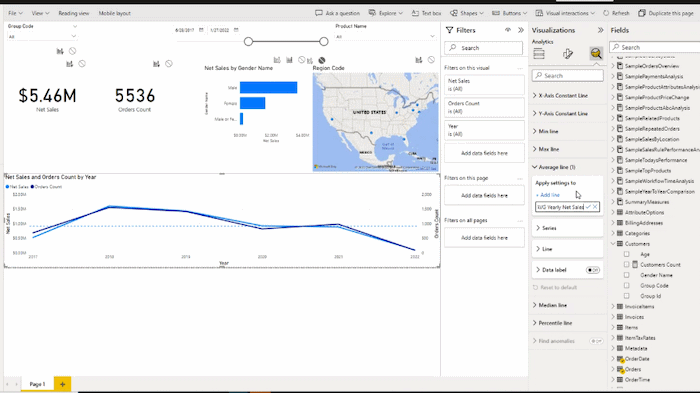
To calculate the average sales over your chosen period, you can simply find the total value of all sales orders in the chosen timeframe and divide by the intervals.
Step 5: Configure Interactions
Let's research your dataset in a more deep way. To proceed with Configure Interactions feature in Power BI service, enable Edit Interactions option:
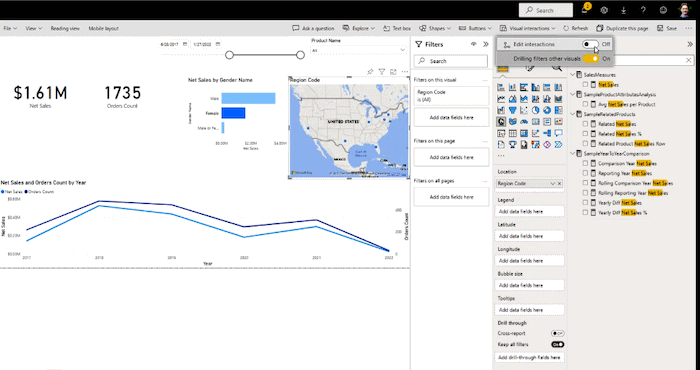
NB: this option is disable by default! In order to use it, you need to enable it in your own PBI report interface! Below we will teach you how to quickly do it.
By using Configure Interactions, we may manually set what KPI(s) will not influence our visual elements of the BI report .
If you want to block one or more KPIs, click on the "block" button above your KPI(s) as it is show on the picture below:

Step 6: Saving Power BI Service Report
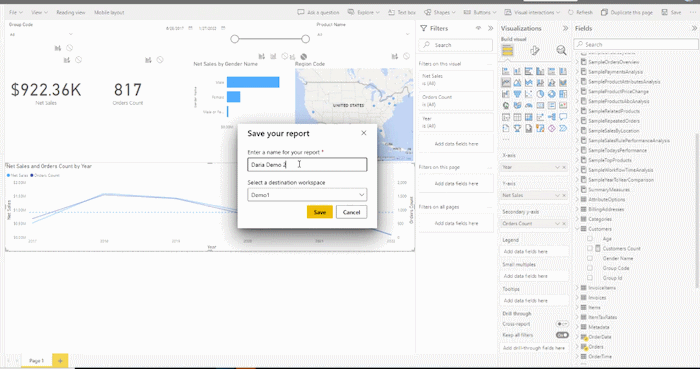
Finally, click File - Save as. It will be saved in the same workspace as your dataset.

“Save your report” window will open. Name your report as you wish.
To make a sound driven decision in any business means to back up it with factual data. Get Magento Sales Cube extension package and make your BI reporting process generate you more profit. Bring your Magento 2 business intelligence reporting knowledge to the next stage of growth.
Magento is now Adobe Commerce
Adobe BI extension Adobe Commerce is a platform for creating multi-functioning management & marketing experience for B2B and B2C. With Adobe Commerce Power BI integration, every Adobe Commerce merchant can load his or her online webstore data to Power BI, thus having it vizualized. Adobe Commerce BI Extension when integrated to Power BI will help to have a clear view on your future business development.


