We use cookies to improve your experience on our website and for marketing. Private Policy.

How to Improve Your Sales? The Best Approach to Data Analysis
July 22, 2024
Data analysis involves examining raw data to draw conclusions and identify patterns. It is a powerful tool that can help businesses understand their market, optimize their operations, and ultimately increase sales. The process typically involves collecting data, cleaning it, analyzing it, and interpreting the results to inform strategic decisions.
Best Practices for Data Analysis

1.Define Clear Objectives
Before diving into data analysis, its crucial to define clear objectives. Knowing what you want to achieve helps in identifying the relevant data and choosing the appropriate analysis techniques. For example, are you looking to understand customer preferences, identify high-performing products, or optimize your sales funnel?
2.Collect Relevant Data
Collecting accurate and relevant data is the foundation of effective data analysis. Data can come from various sources, including sales records, customer feedback, website analytics, and social media interactions. Ensuring the data is clean and well-organized is essential for accurate analysis.
3.Use the Right Data Analysis Techniques
Choosing the right data analysis technique is vital for obtaining meaningful insights. Some common techniques include descriptive analysis (summarizing data), diagnostic analysis (identifying reasons behind outcomes), predictive analysis (forecasting future trends), and prescriptive analysis (suggesting actions). The right technique depends on your objectives and the nature of your data.
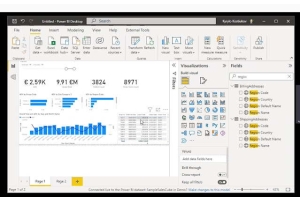
4.Leverage Data Visualization
Data visualization tools, such as charts, graphs, and dashboards, make it easier to understand complex data. Visualizations can highlight trends, outliers, and patterns that might not be apparent in raw data. They also make it easier to communicate findings to stakeholders.
5.Ensure Data Quality
Data quality is critical for reliable analysis. This involves cleaning the data to remove duplicates, filling in missing values, and correcting errors. High-quality data ensures that the analysis is accurate and the insights are actionable.
6. Analyze Data Regularly
Regular data analysis helps in tracking performance over time and making timely adjustments. It allows businesses to stay ahead of trends, respond to changes in customer behavior, and continuously improve their sales strategies
How InsightsReady Can Help
InsightsReady offers a suite of tools designed to help businesses leverage data for improved sales performance. With our Power BI Reporting Suite for Adobe Commerce and Power BI Reporting Suite for Magento, businesses can seamlessly integrate their data sources and gain comprehensive insights into their sales operations.

- InsightsReady: Our platform provides powerful data analysis tools that help businesses make data-driven decisions.
- Power BI Reporting Suite for Adobe Commerce: Tailored for businesses using Adobe Commerce, this suite offers detailed reports and dashboards to monitor and optimize sales performance.
- Power BI Reporting Suite for Magento: Designed for Magento users, this suite provides actionable insights into sales trends, customer behavior, and inventory management.
Data analysis is a powerful tool for improving sales. By defining clear objectives, collecting relevant data, using appropriate analysis techniques, and leveraging data visualization, businesses can gain valuable insights that drive sales growth. Regular analysis and continuous improvement are key to staying competitive and meeting the evolving needs of customers.
Adopting these best practices in data analysis can transform how you understand and approach your sales strategy, leading to more informed decisions and better business outcomes. With InsightsReady, you can harness the power of data to achieve your sales goals and drive business success.
0 Comment(s)
Recent Posts


Featured Posts