We use cookies to improve your experience on our website and for marketing. Private Policy.

Power BI Updates: Key Features and Benefits for Insights Ready Clients
July 25, 2024
The latest Power BI updates bring a suite of powerful new features designed to enhance data analytics capabilities. InsightsReady clients can significantly benefit from these updates through our Power BI Reporting Suite. Heres a comprehensive look at these updates and how they can be utilized effectively.
Feature Summary Highlights

Enhanced Data Connectivity
The last update introduces improved data connectivity options, allowing users to connect more seamlessly to a broader range of data sources. This enhancement simplifies the data integration process and reduces the time needed to set up data connections.
Advanced Visualizations
New and enhanced visualizations, including additional chart types and customization options, provide more intuitive and versatile ways to represent data. These visualizations enhance the ability to analyze and present data in meaningful ways.
Real-Time Data Updates
Expanded real-time data update capabilities ensure that users always have access to the most current data. This feature is crucial for maintaining up-to-date insights and making timely decisions based on the latest information.
Improved AI Integration
Enhanced AI features offer more sophisticated analytics and predictive insights, enabling deeper data analysis. This includes improved machine learning models and AI-driven data insights.
Collaboration and Sharing Enhancements
New features for collaboration and sharing make it easier for teams to work together and share insights across the organization. These enhancements facilitate better communication and data sharing.
Power BI Enhanced Report Format (PBIR)
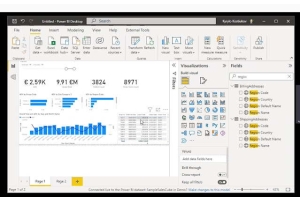
The new PBIR format for Power BI Projects (PBIP) supports source-control friendly file formats, simplifying the tracking of changes and enhancing development efficiency. This format uses properly formatted JSON and organizes each visual, page, bookmark, etc., into separate files within a folder structure.
Show Visuals as Tables on Mobile
A new view mode in the Power BI mobile app allows users to show visuals as tables. This feature makes reports more accessible for users who rely on screen readers and those who prefer viewing data in a tabular format.
New Visuals in AppSource
Addition of new visuals such as Word Cloud by Powerviz and Drill Down Timeline PRO by ZoomCharts. These visuals provide new ways to represent and analyze data.
Optimized Performance
The update focuses on optimizing performance, ensuring faster report loading times and more efficient data processing. This improvement enhances the overall user experience and productivity.
Enhanced Security
Improved security features ensure that sensitive business data is protected. These enhancements are crucial for maintaining data integrity and complying with data protection regulations.
Customizable Dashboards
Expanded options for customizable dashboards allow users to tailor their reporting environment to their specific needs. This customization enhances the relevance and usability of reports.
New Reporting Tools
Additional tools for data manipulation and presentation provide users with more options for creating detailed and informative reports.

Benefits for InsightsReady Clients
Streamlined Data Integration
Easily connect and import data from various sources, reducing integration complexity and time. A retail business using Magento can integrate sales data from their e-commerce platform with customer data from their CRM, providing a comprehensive view of customer behavior and sales performance.
Unified Data View
Consolidate data from multiple platforms for a holistic view of business performance, aiding in better decision-making. An online store can combine inventory data, sales data, and website traffic data to optimize stock levels and marketing strategies.
Detailed Insights
Create more engaging and informative dashboards with new chart types, providing clearer insights into sales, customer behavior, and inventory levels. Use advanced visualizations to track the performance of different product categories, helping identify bestsellers and underperforming items.
Instant Decision-Making
Access up-to-date data to make timely decisions, essential for dynamic e-commerce environments. Monitor real-time sales data to quickly adjust marketing campaigns or inventory levels in response to changing demand.
Predictive Analytics
Utilize AI to forecast sales trends and customer behaviors, aiding in strategic planning and marketing efforts. Implement AI-driven models to predict future sales trends, allowing for proactive inventory management and targeted marketing campaigns.
Enhanced Customer Insights
Gain deeper insights into customer preferences and purchasing patterns, improving personalization and customer satisfaction. Analyze customer purchase history and behavior to offer personalized product recommendations and promotions.
Team Efficiency
Facilitate better teamwork and communication, allowing for more collaborative data analysis and decision-making. Teams can collaborate on shared dashboards and reports, ensuring all stakeholders have access to the same information and can make informed decisions.
Improved Accessibility
Enhance accessibility for users who rely on screen readers or prefer data in a tabular format. Enable the Show Visuals as Tables feature to make reports more accessible to team members with visual impairments or those who prefer a tabular data format.
Marketing Analysis
Use Word Cloud to visualize customer feedback and SEO keywords, gaining quick insights into key themes. Visualize customer reviews and feedback to identify common themes and areas for improvement in products or services.
Time-Series Analysis
Utilize Drill Down Timeline PRO for detailed insights into sales trends, allowing for effective time-based data analysis. Analyze sales data over time to identify seasonal trends and plan marketing campaigns accordingly.
Increased Productivity
Experience smoother and quicker access to reports, enhancing overall business productivity. Faster report loading times allow teams to spend more time on analysis and strategy rather than waiting for data to load.
Data Protection
Ensure sensitive business and customer data is protected, complying with data protection regulations. Use enhanced security features to safeguard customer information and comply with GDPR or other data protection laws.
Personalized Reporting
Tailor dashboards to highlight key performance indicators specific to business needs, providing a more relevant and actionable overview. Create custom dashboards for different departments, such as sales, marketing, and inventory management, to focus on their specific KPIs.
Detailed Analysis
Utilize advanced reporting tools to create more comprehensive and detailed reports, providing deeper insights into business operations. Use new reporting tools to analyze customer lifetime value and segment customers based on their purchasing behavior.
Enhanced Presentation
Present data in a more compelling and informative manner, improving stakeholder engagement and understanding. Create visually appealing reports for presentations to stakeholders, clearly communicating business performance and strategic insights.
The latest updates to Power BI offer InsightsReady clients an array of new features to enhance their data analytics capabilities. By integrating these updates with InsightsReadys Power BI Reporting Suite, businesses can gain deeper insights, improve operational efficiency, and drive growth. These enhancements ensure that our clients stay competitive and data-driven in a rapidly evolving market.
For more information on how InsightsReady can help your business leverage these Power BI updates, visit our website or contact us today.
0 Comment(s)
Recent Posts


Featured Posts